Trend analysis of Marine Fisheries of India
Trend analysis of Marine Fisheries of India
Introduction
The fisheries sector plays an important role in Indian economy contributing about 1% to the Gross Domestic Product (GDP). The marine fish production in the country gradually increased from mere 5.8 lakh t in 1950 to 3.32 million t in 2010, registering a six-fold increase. The development of fisheries sector in India can be classified into three phases. During the first phase (1950 – 66), landings were mainly by non-mechanized indigenous crafts and gears and remained below one million t. The second phase spanning from 1967- 86 featured increased mechanization, improved gear materials, an introduction to motorized country crafts, expansion in export trade, etc. The last phase during 1987 – 2010 witnessed an intensification of mechanization as well as motorization of country crafts, modification of gears, multi-day voyage fishing and expansion of fishing grounds. Export earnings from marine sector increased from Rs 3.92 crores in 1961-62 to Rs 12,901.47 crores in 2010-11 registering 11.8% growth during 2009-10.
The gross revenue from the marine fish landings during 2009-10 regarding landing centre price was estimated as Rs 19,753 crores. The total fisherfolk population of the country is 3.52 million having 0.72 million active fishermen. There are about 2,39,000 fishing crafts engaged in marine capture fisheries, of which 59,000 are mechanized crafts, 76,000 motorized and the rest non-mechanized. In the mechanized sector, there are about 29,000 trawlers. Though fishing is concentrated mainly in the depth zone up to 100 m, deep sea trawlers operate up to 400 m depth zone.
Overview of Indian Marine Fisheries
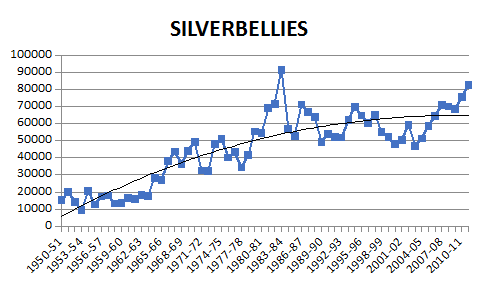
A tremendous growth is witnessed in Indian marine fisheries in the past six decades; it raised from 0.66 million t during 1950-60 to 3.06 million t in 2006-10. An average landing has increased significantly with maximum growth percentage observed during 1971-80, which could be attributed to the introduction of motorized country crafts. This is mainly due to the increased landings of oil sardine, the major contributor of this group, by extending its areas of an intensive harvest to the entire south region both on east and west coasts. Apart from this, the introduction of new gears like purse seines and ring seines augmented the exploitation of pelagic shoals like sardines and anchovies. In case of mackerel landings, fluctuations were high during the first four decades with maximum growth rate during 1991-2000 and showed negative growth during the last decade. The seer fish landings showed positive growth throughout the period with the greatest growth during 1991-2000 and minimum during the last decade. Steady growth was observed in the landings of tuna from 1975 onwards, and the growth rate gradually reduced over decades. Bombay duck landings registered positive growth throughout the period, though the growth rate was slow in the later periods. The landings of silver bellies have shown upward growth from 1965 to 1990 and remained steady after that. Similarly, arrivals of barracudas have shown steady growth from 1981 onwards. Except for the period 1991-2000, the landings of pomfrets showed positive growth trend. Catfish landings fluctuated in an oscillatory manner and had shown high growth rate in the last decade. Landings of flatfishes remained low until 1980, showed increasing trend during the subsequent 20 years and the catch slightly reduced during the last 10 years. Elasmobranch landings were recorded fast growth initially, declined later and exhibited negative growth in the last decade. In the later half of the last decade, there was a slight increase in elasmobranch landings, though statistically not significant. The landings of mullets have shown increase up to 2000 and slightly declined in the last decade. Unicorn cod landings decreased over the decades, and the landings were less during the last 10 years. An increasing trend was observed in the crustacean landings from 1970. This could be attributed to the extension of fishing ground beyond 100 m depth zone to exploit deep sea crustacean resources. A consistent growth was observed in molluscs landings from 1975 onwards mainly because of the targeted fishing and the maximum growth was observed during 1971-80. The growth was comparatively low during 2001-10.
Decade wise an average landing, CV, and growth rate for total Indian marine fisheries (1950- 2010)
|
Period |
Average landings (t) |
CV (%) |
Growth (%) |
|
1950-1960 |
656844 |
18.84 |
- |
|
1961-1970 |
832426 |
15.62 |
26.73 |
|
1971-1980 |
1259624 |
9.91 |
51.32 |
|
1981-1990 |
1702478 |
16.17 |
35.16 |
|
1991-2000 |
2408741 |
9.22 |
41.48 |
|
2001-2010 |
2773996 |
12.61 |
15.16 |
Species wise trend
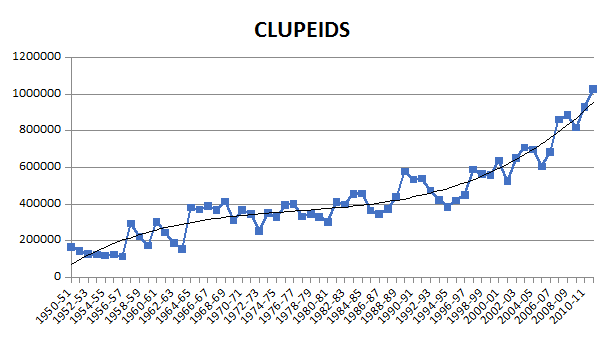
Clupeids are one of the most important group of pelagic fishes, which comprises of oil sardine (Sardinella longiceps), lesser sardines (Sardinella albella, Sardinella gibbosa, Sardinella fimbriata and Sardinella sirm), white baits (Stolephorus spp., Enchrasicholina spp.) and anchovies (Thryssa spp., Setipinna spp. and Coilia spp.). Clupeids has accounted greater than 20% of the total marine fish landings in India and a maximum of 38% accounted during 1961 – 70. And, the decadal average has improved from 173,299 t (1950-60) to 739,135 t (2001-10), it increases except the 1960s and 1970s. The CV was high in the early decades but has reduced to about 16% in the last three decades indicating comparatively less variability in the landings as compared to prior years. The maximum landings of clupeids (929,404 t) were recorded in 2010.
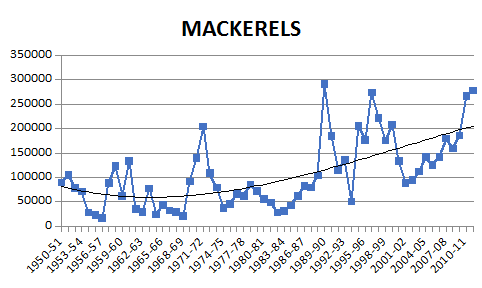
Fishery of mackerels is supported by three species, Rastrelliger kanagurta, Rastrelliger brachysoma and Rastrelliger faughni with major contribution by the Indian mackerel (Rastrelliger kanagurta). During 2008-10, the average annual landings of Indian mackerel in the country was 2,04,077 t which accounted for 6.3% of the total landings. The decadal average of mackerel landings increased from 74,405 t during 1950-60 to 1,70,468 t during 1991-2000 and then reduced to 1,50,063 t during 2001-10. Though the average landings over decades increased, the percentage contribution of mackerel towards total landings decreased from 11.33% during 1950-60 to 5.41% during 2001-10. During the past 10 years, average mackerel landings significantly increased from 113,274 t in the first half to 186,853 t in the second half. The CV in landings of mackerel was high in the initial decades, and during the last 20 years it has reduced, showing less fluctuation in landings. The maximum landings of mackerel were 291,077 t in 1989.
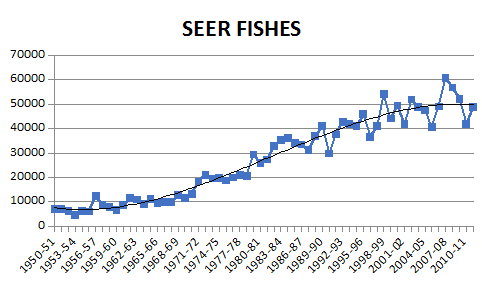
Seerfishes are one of the commercially important and high valued marine pelagic finfish in India. The important species contributing to the seer fish landings are king seer (Scomberomorus commerson), spotted seer (Scomberomorus guttatus), streaked seer (Scomberomorus lineolatus) and wahoo (Acanthocybium solandri) of which the first two species form more than 90% of the landings. Over the years, their average decadal landings increased from 7,403 t during 1950-60 period to 49,351 t during 2001-10, registering a six-fold increase. The percentage contribution of seerfishes towards total landings varied between 1.13% during 1950-60 and 1.99% during 1981-90. The CV was high during the first decade and low afterward. The average landings during 2008-10 were 50,260 t which formed 82.66% of the maximum landings of 60,801 t in 2007.
The tuna fishery in Indian waters is supported by eight species viz., little tuna (Euthynnus affinis), frigate tuna (Auxis thazard), bullet tuna (Auxis rochei), skipjack tuna (Katsuwonus pelamis), longtail tuna (Thunnus tonggol), yellowfin tuna (Thunnus albacares), striped bonito (Sarda orientalis) and dogtooth tuna (Gymnosarda unicolor). The decadal average of tuna increased from 2,854 t in 1950-60 and to 55,198 t during 2001-10. The average tuna landings have increased rapidly in the second half of last decade (2001-10) compared to the first half. The percentage contribution of tunas in the total marine fish landings increased from 0.43% in 1950- 60 to 1.99% during 2001-10. Fluctuations in landing were high during the first four decades as indicated by the CV and it has reduced considerably in the last two decades.
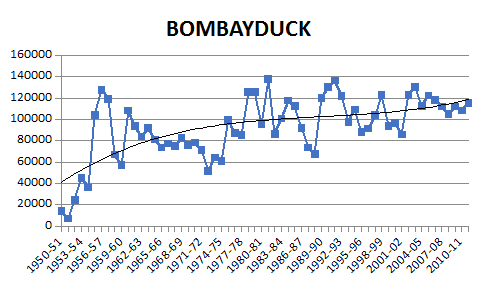
Bombay duck (Harpadon nehereus), an average landing of 64,698 t during 1950-60, it increased to 112,967 t during 2001-10. Though the average landings increased over decades, it was not in proportion to the increase in total landings. Percentage contribution during 1950-60 was 9.85% which reduced to 4.07% during 2001-10. The CV in landings also reduced over decades indicating stability in landings of Bombay duck in the recent years. A maximum landing of Bombay duck was observed about 137,790 t in 1981.
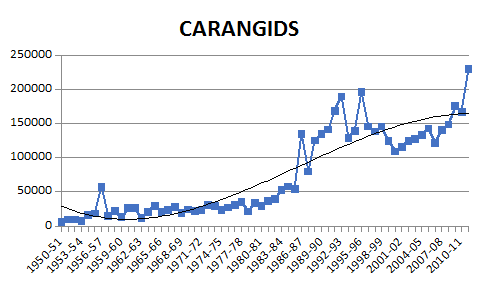
Carangids are present around the Indian coast; there are about 62 species; among commercial fishery sustained mainly by the horse mackerel, scads, leather jackets, moonfish, rainbow runner, cobia, trevallies, queen fishes, dolphin fishes and pompanos. The average decadal landings of carangids increased from 18,254 t during 1950-60 to 1,49,604 during 1991-2000. Contribution to the total landings also increased from 2.78% during 1950-60 to 6.21% during 1991-2000. The variation in the average catches over the consequent decades was not significant except between 1971-80 and 1981-90. The CV was high (75.24%) in the first ten years, and it decreased over decades to reach 12.94% in the last 10 years. The maximum annual landings during the period were 196,868 t in 1995.
Silverbellies is supported by the fishes of the family Leiognathidae viz., Leiognathus bindus, Leiognathus brevirostris, Leiognathus splendens, Leiognathus dussumieri, Gazza minuta and Secutor insidiator. The decadal average of annual landings increased from 15,505 t during 1950-60 to 62,116 t in 2001-10. The percentage contribution did not change much and it remained at 2.24% during 2001-10 against 2.36% during 1950-60. During the last decade, there was a significant increase in average landings from 54,295 t in the first half to 69,937 t during the second half.
White fish (Big jawed jumber) is supported by single species, Lactarius lactarius, also known as false trevallies. The CV in landings reduced from 115.16% during 1950-60 to 55.71% during 2001-10. Even though the growth showed a positive trend during the initial decades, the last two decades witnessed a declining trend. There was a significant difference in decadal landings except between 1950-60 and 1961-70. The maximum landings were observed 25,337 t in 1985.
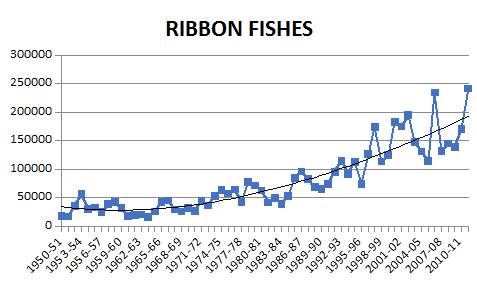
Ribbonfishes Trichiurus lepturus is the dominant species under this group which forms more than 90% of the ribbonfish landings. Other ribbonfishes present in the catches are Eupleurogrammus glossodon, Eupleurogrammus muticus and Lepturacanthus savala. The decadal average landings increased from 31,215 t in 1950-60 to 158,751 t during 2001-10 realizing almost fivefold increase. The CV in annual landings reduced from 36.53% during 1950-60 to 21.72% during 2001-10, indicating more stability during recent years. The maximum annual landings realized was 235,045 t in 2006.
Half beaks and full beaks Half beaks belong to the family Hemirhamphidae and species contributing to the fishery are Hemirhamphus far, Hemirhamphus marginatus and Rhynchorhamphus georgi. Species contributing to the landings of full beaks (family Belonidae) are Ablennes hians, Strongylura leiura, Tylosurus acus melonatus and Tylosurus crocodilus. The decadal CVs have reduced from 120% during 1950-60 to 26% during 2001-10. A maximum landing was recorded of 6,993 t in 2000.
Flying fishes Cheilopogon furcatus, Cheilopogon spilopterus, Cypselurus oligolepis, Exocoetus volitans, Hirundichthys oxycephalus, Parexocoetus brachypterus and Prognichthys brevipinnis are the major species contributing to the fishery of flying fishes. The observed maximum during the last six decades was 13,163 t in 1989. The CV for different decades varies between 43.96% and 109.37% showing highly fluctuating nature of flying fish landings.
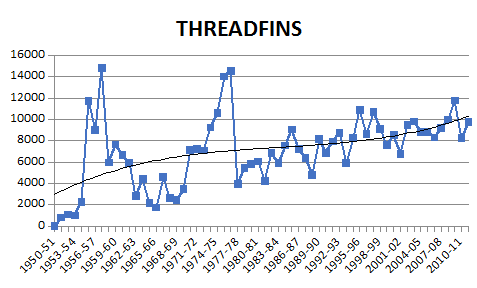
Threadfins in the fishery were supported by Polynemus spp. and Eleutheronema tetradactylum. The decadal average of annual landings increased from 5,551 t during 1950-60 to 9,209 t during 2001-10. The significant difference in average landings was observed between 1961-70 and 1971-80 and also between 1981-90 and 1991-2000. The CV in annual landings reduced from 85.43% during 1950-60 to 13.16% during 2001-10 showing less variability during the last decade. An annual average of threadfin landings during 2008-10 was 10,075 t and the maximum landings observed was 14,846 t in 1957.
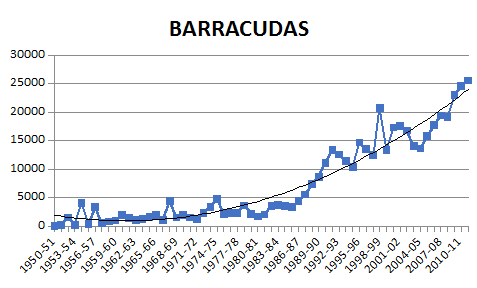
The barracudas also are known as sea-pikes, are pelagic in habitat and are caught at varying depths along the Indian coast. Several species are constituted the fishery dominated by Sphyraena obtusata, Sphyraena barracuda, Sphyraena picuda, Sphyraena jello, Sphyraena flavicauda and Sphyraena forsteri. The decadal average of landings also improved over years and reached 18,501 t during 2001-10 from 1,280 t during 1950-60. The CV in landings reduced over decades to 17.58% during 2001-10 from 100.20% during 1950-60, indicating stability in landings during the last decade. The maximum observed landings were 24,782 t in 2010.
Perches comprise of a diverse group of fishes viz., rock cods, snappers, pig face breams, threadfin breams and other perch resources. The average contribution of perches towards the total landings in the country has increased from 1.45% during 1950-60 to 7.22% during 2001-10. The average annual landings of perches during 1950-60 was 9,504 t which rose to 2,00,369 t during 2001-10. Significant differences were noticed between average landings of perches in the consecutive decades with an increasing trend over decades. The maximum annual landings of perches obtained so far were 251,740 t in the year 2008. The CV in their landings reduced from 62.51% during 1950-60 to 12.33% during 2001-10 showing more stability in landings in the recent years.
Dominant species in landings of croakers are Johnius belangerii, Johnius carutta, Nibea soldado, Nibea maculata, Johnieops vogleri, Johnieops sina, Otolithes ruber, Kathala axillaris, Otolithoides biauritus, Protonibea dicanthus, Pennahia macrophthalmus and Dendrophysa russelli. The landings of croakers have increased over decades and reached an average of 1,59,835 t during 1991-2000 from 37,255 t during 1950-60. The CV in landings of croakers during 1950-60 was 39.97% which reduced to 9.92% during 1981-90 and increased after that to reach 21.71% during 2001-10.
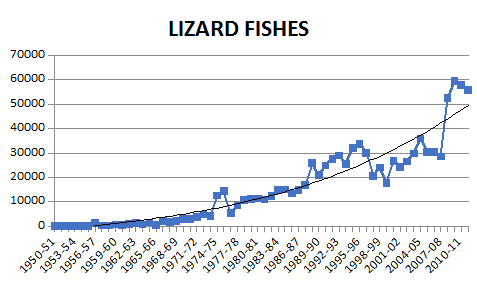
Lizardfish fishery is supported mainly by the species Saurida tumbil, Saurida undosquamis, Synodus indicus and Trachinocephalus myops. The average landings of lizardfishes during 2008-10 was 56,612 t contributing 1.35% to the total landings. The CV in landings reduced over decades and during the last decade, it increased to 34%. The maximum annual landings observed so far was 59,497 t in 2009.
Goatfishes Parupeneus indicus, Parupeneus barberinus, Upeneus moluccensis, Upeneus sulphureus, Upeneus tragula, Upeneus vittatus and Mulloides flavolineatus are the dominant species of goatfishes in the landings. The coefficient of variation in landings of goatfishes reduced from 103.55% during 1950-60 to 38.7% during 2001-10 indicating more stability in the quantity landed in the last decade. The maximum landings of goatfishes observed were 33,298 t in 1991.
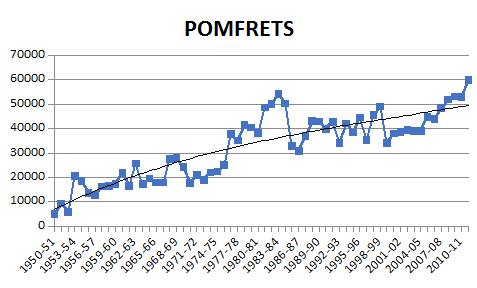
Pomfret fishery is supported by the silver pomfret (Pampus argenteus) and Chinese pomfret (Pampus chinensis) of the family Stromateidae and black pomfret (Parastromateus niger) of the family Carangidae. Silver pomfret support significant share of the catch. The contribution of pomfrets towards marine fish landings during 1950-60 was 2.18% and it reduced to 1.63% during 2001-10, though the average landings increased from 14,328 t during 1950-60 to 45,114 t during 2001-10. The CV in landings of promfrets decreased from 37.65% during 1950-60 to 12.09% during 2001-10. The observed maximum landings of pomfrets were 54,217 t in 1983.
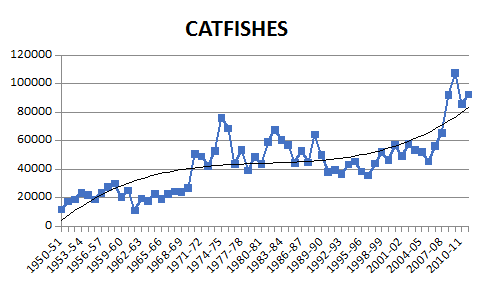
Landings of catfishes are supported mainly by fishes of the family Aridae (Tachysuridae). Dominant species in the landings are Arius arius, Arius thalassinns, Arius dussumieri, Arius sona, Tachysurus serratus, Tachysurus tenuispinis, Osteogeneiosus militanis and Plotosus canius. During 2008-10, catfishes formed 2.91% of the total landings in the country. Though the decadal average landings showed increasing trend.
Flatfishes are supported by halibut, flounders and soles, with more than 95% being contributed by soles. Dominant species in landings of flatfishes are Cynoglossus macrostomus, Cynoglossus macrolepidotus and Psettodes erumei. The decadal average landings increased from 9,167 t in 1950-60 to 46,859 t in 1991-2000. As indicated by the CV, the fluctuation was high during 1950-60 (84%) and it reduced to 8.98% during 2001-10.
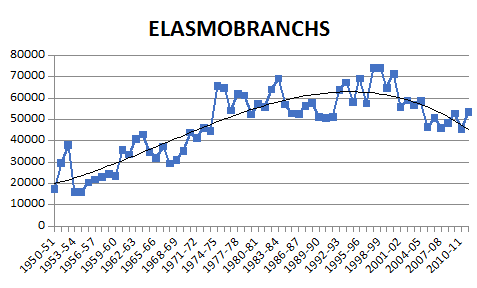
Elasmobranchs form an important group comprising sharks, skates and rays, having the diverse commercial use for their body parts. During 2008-10, elasmobranchs constituted 1.49% of all India total marine fish landings. During 2001-10 the difference between first and last five years' average landings was not significant indicating that the decrease in landings in the last decade is continuous over the ten-year period and not restricted to recent years. The maximum observed landings was noticed about 75,304 t in 1997.
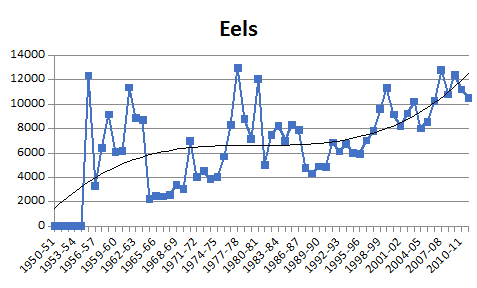
The eels landing is dominated belong to the genera Congresox, Anguilla, Nemichthys, Gymnothorax, Conger, and Uroconger. The landings of eels showed positive growth throughout the period, except during 1981-90. The maximum observed annual landings of eels were 12,997 t in 1977.
The mullets fishery is supported by several species dominated by Mugil cephalus, Mugil cunnesius, Liza macrolepis, Liza parsia, Liza tade, Ellochelon vaigiensis, Valamugil seheli and Rhinomugil corsula. The decadal average of annual landings of mullets increased from 380 t during 1950-60 to 6,369 t during 2001-10. The percentage contribution of mullets towards total landings increased from 0.06% during 1950-60 to 0.31% during 1981-90.
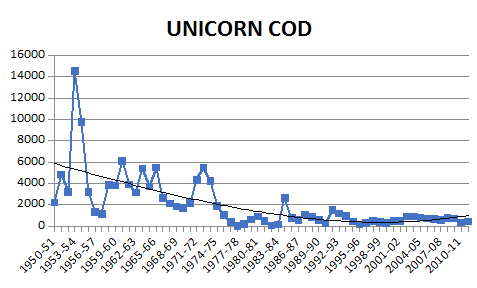
Fishery of unicorn cod is mainly confined to Gujarat state and supported by single species, Bregmaceros macclellandi which is also known as spotted codlet. Their average contribution in the total landings during 1950-60 was 0.75% which decreased to 0.02% during 2001-10. The maximum landings of 14,566 t were found in 1953.
Crustacean fishery was supported by penaeid and non-penaeid shrimps, lobsters, crabs and stomatopods. The landings of penaeid shrimps were constituted mainly by Parapenaeopsis stylifera, Metapenaeus dobsoni, Metapenaeus monoceros, Metapenaeus affinis, Solenocera crassicornis and Penaeus indicus. The most abundant non-penaeid shrimps are Acetes spp., Nematopalaemon tenuipes and Exhippolysmata ensirostris. Crabs in the landings were dominated by Portunus pelagicus and Portunus sanguinolentus. Lobsters are widely distributed along the Indian coast, and the fishery is supported mainly by Panulirus homarus, Panulirus ornatus, Panulirus penicillatus, Panulirus polyphagus, Panulirus versicolor, Thenus orientalis and Puerulus sewelli. The contribution of crustaceans towards marine fish landings in India during 1950-60 was 15.24% and it continued to contribute at the same proportion over the decades. The decadal average of annual landings increased from 1,00,128 t during 1950-60 to 4,23,374 t during 2001-10. The CV reduced from 32.66% of 1950-60 to 10.82% during 2001-10 showing fewer fluctuations during the last decade.
Bivalves, gastropods, squids, cuttlefishes, and octopus are the major contributors to the molluscan fishery of India. The decadal averages registered a steady growth during the period. From an average of 74 t per year in 1950-60, the landings have gone up to 1,26,168 t during 2001-10. The contribution of molluscs increased from 0.01% during 1950-60 to 4.55% during 2001-10.
|
Clupeids |
Mackerel |
Seerfish |
Tuna |
|||||||||||||
|
Average landings (t) |
CV (%) |
Growth (%) |
% of total landings |
Average landings (t) |
CV (%) |
Growth (%) |
% of total landings |
Average landings (t) |
CV (%) |
Growth |
% of total landings |
Average landings (t) |
CV (%) |
Growth (%) |
% of total landings |
|
|
1950-1960 |
173299 |
38.06 |
26.38 |
74405 |
50.6 |
11.33 |
7403 |
26.24 |
1.13 |
2854 |
51.98 |
|
0.43 |
|||
|
1961-1970 |
318657 |
27.18 |
83.88 |
38.28 |
52035 |
70.38 |
-30.07 |
6.25 |
10937 |
12.04 |
47.74 |
1.31 |
3607 |
37.31 |
26.38 |
0.43 |
|
1971-1980 |
338016 |
11.76 |
6.08 |
26.84 |
81515 |
55.63 |
56.65 |
6.47 |
21412 |
15.47 |
95.78 |
1.7 |
11813 |
51.85 |
227.5 |
0.94 |
|
1981-1990 |
435283 |
16.18 |
28.78 |
25.57 |
95175 |
82.5 |
16.76 |
5.59 |
33844 |
10.86 |
58.06 |
1.99 |
28562 |
43.58 |
141.78 |
1.68 |
|
1991-2000 |
507660 |
16.33 |
16.63 |
21.08 |
170468 |
35.57 |
79.11 |
7.08 |
43847 |
11.76 |
29.56 |
1.82 |
42915 |
12.54 |
50.25 |
1.78 |
|
2001-2010 |
739135 |
16.62 |
45.6 |
26.65 |
150063 |
33.08 |
-11.97 |
5.41 |
49351 |
12.72 |
12.55 |
1.78 |
55198 |
21.82 |
28.62 |
1.99 |
|
Bombay duck |
Carangids |
Silverbellies |
Whitefish |
||||||||||||||
|
Average landings (t) |
CV (%) |
Growth (%) |
% of total landings |
Average landings (t) |
CV (%) |
Growth (%) |
% of total landings |
Average landings (t) |
CV (%) |
Growth |
% of total landings |
Average landings (t) |
CV (%) |
Growth (%) |
% of total landings |
|
|
|
1950-1960 |
64698 |
64.52 |
|
9.85 |
18254 |
75.24 |
|
2.78 |
15505 |
20.68 |
|
2.36 |
5725 |
115.16 |
|
0.87 |
|
|
1961-1970 |
81438 |
7.98 |
25.87 |
9.78 |
22785 |
20.96 |
24.82 |
2.74 |
31930 |
36.1 |
105.93 |
3.84 |
6678 |
23.81 |
14.27 |
0.8 |
|
|
1971-1980 |
86752 |
28.04 |
6.53 |
6.89 |
28552 |
15.46 |
25.31 |
2.27 |
43385 |
19.02 |
35.88 |
3.44 |
9037 |
32.29 |
26.1 |
0.72 |
|
|
1981-1990 |
103929 |
21.64 |
19.8 |
6.1 |
85916 |
47.85 |
200.91 |
5.05 |
64719 |
18.27 |
35.88 |
3.8 |
13785 |
39.01 |
34.45 |
0.81 |
|
|
1991-2000 |
106337 |
14.29 |
2.32 |
4.41 |
149604 |
17.57 |
74.13 |
6.21 |
58918 |
11.34 |
-8.96 |
2.45 |
6769 |
24.06 |
-103.63 |
0.28 |
|
|
2001-2010 |
112967 |
10.32 |
6.23 |
4.07 |
140468 |
12.94 |
-6.11 |
5.06 |
62116 |
14.27 |
5.43 |
2.24 |
6392 |
55.71 |
-5.91 |
0.23 |
|
|
Ribbonfishs |
Half beaks and full beaks |
Flying fish |
Threadfins |
||||||||||||||
|
Average landings (t) |
CV (%) |
Growth (%) |
% of total landings |
Average landings (t) |
CV (%) |
Growth (%) |
% of total landings |
Average landings (t) |
CV (%) |
Growth |
% of total landings |
Average landings (t) |
CV (%) |
Growth (%) |
% of total landings |
|
|
|
1950-1960 |
31215 |
36.53 |
|
4.75 |
177 |
120.78 |
|
0.03 |
2116 |
75.51 |
|
0.32 |
5551 |
85.43 |
|
0.85 |
|
|
1961-1970 |
28326 |
31.05 |
-9.26 |
3.40 |
1387 |
61.47 |
683.62 |
0.17 |
2506 |
55.60 |
18.43 |
0.30 |
3736 |
44.74 |
-32.70 |
0.45 |
|
|
1971-1980 |
57315 |
21.89 |
102.34 |
4.55 |
1660 |
63.48 |
19.68 |
0.13 |
2710 |
97.61 |
8.14 |
0.22 |
8412 |
41.09 |
125.16 |
0.67 |
|
|
1981-1990 |
65326 |
28.14 |
13.98 |
3.84 |
2309 |
24.98 |
39.10 |
0.14 |
3158 |
109.37 |
16.53 |
0.19 |
6717 |
20.63 |
-20.15 |
0.39 |
|
|
1991-2000 |
121261 |
26.92 |
85.62 |
5.03 |
4201 |
39.35 |
81.94 |
0.17 |
2646 |
69.73 |
-16.21 |
0.11 |
8742 |
16.00 |
30.15 |
0.36 |
|
|
2001-2010 |
158751 |
21.72 |
30.92 |
5.72 |
4889 |
26.86 |
16.38 |
0.18 |
2684 |
75.45 |
1.44 |
0.10 |
9209 |
13.16 |
5.34 |
0.33 |
|
|
Barracudas |
Perches |
Croakers |
Lizard fish |
|||||||||||||
|
Average landings (t) |
CV (%) |
Growth (%) |
% of total landings |
Average landings (t) |
CV (%) |
Growth (%) |
% of total landings |
Average landings (t) |
CV (%) |
Growth |
% of total landings |
Average landings (t) |
CV (%) |
Growth (%) |
% of total landings |
|
|
1950-1960 |
1280 |
100.20 |
|
0.19 |
9504 |
62.51 |
|
1.45 |
37255 |
39.97 |
|
5.67 |
245 |
145.11 |
|
0.04 |
|
1961-1970 |
1783 |
51.51 |
39.30 |
0.21 |
10935 |
22.69 |
15.06 |
1.31 |
28865 |
19.83 |
-22.52 |
3.47 |
1674 |
48.84 |
583.27 |
0.20 |
|
1971-1980 |
2603 |
38.16 |
45.99 |
0.21 |
29189 |
38.29 |
166.93 |
2.32 |
82476 |
28.73 |
185.73 |
6.55 |
8644 |
42.91 |
416.37 |
0.69 |
|
1981-1990 |
5336 |
50.91 |
104.99 |
0.31 |
77039 |
34.38 |
163.93 |
4.53 |
101635 |
9.92 |
23.23 |
5.97 |
16957 |
28.92 |
96.17 |
1.00 |
|
1991-2000 |
14482 |
21.62 |
171.40 |
0.60 |
149278 |
19.19 |
93.77 |
6.20 |
159835 |
23.31 |
57.26 |
6.64 |
26723 |
17.62 |
57.59 |
1.11 |
|
2001-2010 |
18501 |
17.58 |
27.75 |
0.67 |
200369 |
12.33 |
34.23 |
7.22 |
145738 |
21.71 |
-8.82 |
5.25 |
37581 |
34.28 |
40.63 |
1.35 |
|
Goatfishes |
Pomfrets |
Catfishes |
Flatfishes |
|||||||||||||
|
Average landings (t) |
CV (%) |
Growth (%) |
% of total landings |
Average landings (t) |
CV (%) |
Growth (%) |
% of total landings |
Average landings (t) |
CV (%) |
Growth |
% of total landings |
Average landings (t) |
CV (%) |
Growth (%) |
% of total landings |
|
|
1950-1960 |
2526 |
103.55 |
|
0.38 |
14328 |
37.65 |
|
2.18 |
21585 |
22.20 |
|
3.29 |
9167 |
84.42 |
|
1.40 |
|
1961-1970 |
2646 |
46.25 |
4.75 |
0.32 |
21188 |
20.52 |
47.88 |
2.55 |
23759 |
41.67 |
10.07 |
2.85 |
10021 |
34.35 |
9.32 |
1.20 |
|
1971-1980 |
3933 |
38.70 |
48.64 |
0.31 |
30221 |
28.43 |
42.63 |
2.40 |
51743 |
21.88 |
117.78 |
4.11 |
12706 |
20.20 |
26.79 |
1.01 |
|
1981-1990 |
11429 |
75.43 |
190.59 |
0.67 |
42992 |
17.37 |
42.26 |
2.53 |
53952 |
16.79 |
4.27 |
3.17 |
28631 |
21.26 |
125.33 |
1.68 |
|
1991-2000 |
15982 |
41.37 |
39.84 |
0.66 |
40563 |
12.03 |
-5.65 |
1.68 |
44128 |
15.11 |
-18.21 |
1.83 |
46859 |
15.54 |
63.67 |
1.95 |
|
2001-2010 |
18668 |
38.70 |
16.81 |
0.67 |
45114 |
12.09 |
11.22 |
1.63 |
66455 |
29.68 |
50.60 |
2.40 |
41181 |
8.98 |
-12.12 |
1.48 |
|
Elasmobranchs |
Eels |
Mullets |
Unicorn cod |
|||||||||||||
|
Average landings (t) |
CV (%) |
Growth (%) |
% of total landings |
Average landings (t) |
CV (%) |
Growth (%) |
% of total landings |
Average landings (t) |
CV (%) |
Growth |
% of total landings |
Average landings (t) |
CV (%) |
Growth (%) |
% of total landings |
|
|
1950-1960 |
24141 |
29.37 |
|
3.68 |
3947 |
105.70 |
|
0.60 |
380 |
95.16 |
|
0.06 |
4909 |
77.87 |
|
0.75 |
|
1961-1970 |
36100 |
13.16 |
49.54 |
4.34 |
5201 |
62.59 |
24.11 |
0.62 |
2037 |
42.24 |
436.05 |
0.24 |
3216 |
41.25 |
-34.49 |
0.39 |
|
1971-1980 |
54987 |
15.10 |
52.32 |
4.37 |
7147 |
44.63 |
27.23 |
0.57 |
2643 |
36.03 |
29.75 |
0.21 |
1911 |
99.63 |
-40.58 |
0.15 |
|
1981-1990 |
56723 |
9.86 |
3.16 |
3.33 |
6274 |
24.79 |
-13.91 |
0.37 |
5210 |
51.69 |
97.12 |
0.31 |
742 |
94.90 |
-61.17 |
0.04 |
|
1991-2000 |
65728 |
11.49 |
15.88 |
2.73 |
7656 |
22.59 |
18.05 |
0.32 |
6584 |
20.22 |
26.37 |
0.27 |
616 |
67.60 |
-16.98 |
0.03 |
|
2001-2010 |
52176 |
10.78 |
-20.62 |
1.88 |
10167 |
15.67 |
24.70 |
0.37 |
6369 |
14.62 |
-3.27 |
0.23 |
686 |
25.16 |
11.36 |
0.02 |
|
Crustaceans |
Molluscs
|
|||||||
|
Average landings (t) |
CV (%) |
Growth (%) |
% of total landings |
Average landings (t) |
CV (%) |
Growth (%) |
% of total landings |
|
|
1950-1960 |
100128 |
32.66 |
|
15.24 |
74 |
213.87 |
|
0.01 |
|
1961-1970 |
95442 |
18.49 |
-4.68 |
11.47 |
610 |
74.74 |
724.32 |
0.07 |
|
1971-1980 |
197592 |
11.21 |
107.03 |
15.69 |
7843 |
68.46 |
1185.74 |
0.62 |
|
1981-1990 |
264958 |
17.77 |
34.09 |
15.56 |
32847 |
48.86 |
318.81 |
1.93 |
|
1991-2000 |
415857 |
12.25 |
56.95 |
17.26 |
103133 |
14.51 |
213.98 |
4.28 |
|
2001-2010 |
423374 |
10.82 |
1.81 |
15.26 |
126168 |
20.88 |
22.34 |
4.55 |
Sources
- Alagaraja, K. 1987. A brief appraisal of marine fisheries in India. National symposium on research and development in marine fisheries, CMFRI Bull., 44 (Part -1): 36-41.
- Alagaraja, K., Yohannan, K. C., Ammini, P. L. and Pavithran, P. P. 1987. An appraisal of the marine fisheries in Andhra Pradesh. CMFRI Special Publication (33): 1-52.
- Alagaraja, K., Kurup, K. N., Srinath, M. and Balakrishnan, G. 1982. Analysis of marine fish landings in India: A new approach. CMFRI Special Publication, 10: 1-42.
- Alagaraja, K., Balan, K., Scariah, K. S., Vijayalakshmi, K., Joseph, Andrews and Prasad, C. J. 1992. Present status of exploitation of fish and shellfish resources: Marine fish production of maritime states of the west coast of India. CMFRI Bull., 45: 38-55
- Anon. 2000. Report of the working group for revalidating the potential of fishery resources in the Indian EEZ. Department of Animal Husbandry and Dairying, Ministry of Agriculture, New Delhi, 58 pp.
- CMFRI 2011. Annual Report 2010-11. Central Marine Fisheries Research Institute, Cochin, 163 pp
- Devaraj, M. and Vivekanandan, E. 1999. Marine capture fisheries of India: Challenges and opportunities. Current Sci., 76 (3): 314-332
- James, P. S. B. R., Alagarswami, K., Narayana Rao, K., Muthu, M. S., Rajagopalan, M. S., Alagaraja, K. and Mukundan, C. 1987. Potential marine fishery resources of India. CMFRI Special Publication, 30: 44-74.
- Sathianandan, T.V., Jayasankar, J., Kuriakose, S., Mini, K.G. and Mathew, W.T., 2011. Indian marine fishery resources: optimistic present, challenging future. Indian Journal of Fisheries, 58(4), pp.1-15.
- Srinath, M. 1987. Trend of the major exploited marine fishery resources of India during 1961-’85. National symposium on research and development in marine fisheries, CMFRI Bull., 44 (1): 272-283.
- Srinath, M. and Pillai, N. G. K. 2008. Status of marine fisheries in India, In: Course manual, Winter school on impact of climate change on Indian marine fisheries, CMFRI, Cochin, 18 January to 7 February, 2008.
Last Modified : 7/1/2024
The Article provides information about Antioxidant...
This topic provides information about 20th Livesto...
This topic provides information about Sim Card Swa...
This topic deals with information related to Anxie...
